
These are two lessons on the relationship between linear equations in `ax + by = c` form and their graphs.
The first explores what happens when a point moves left and right, or up and down, and how it affects its relationship to the line's equation. It lays the conceptual groundwork for solving systems graphically.
The second shows what happens graphically when you combine two linear equations by addition, subtraction, and/or scaling, and leads to a strategy for solving systems.
Both lessons involve GeoGebra files, which you can download for use in your classroom.
Off and On
Many students have learned how to graph linear equations, but are not clear on what it means to say that a certain line is the graph of (for example) `2x - y = 3`. One way to throw light on this is through looking at points which are not on the line: for a point (x,y), what is `2x - y` equal to? This video shows me exploring this question.
If you want to do this exploration with your own equations, you can use this applet.
Choose values for `a`, `b`, and `c` (pressing enter for each one.)
Move the point, horizontally or vertically, on or off the line, and see what happens!
A related activity is Letters and Postcards, which applies the ideas from this video to a "real world" question. See also this middle school version.
Add Till It's Plaid
Say you want to solve
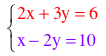
Graph the two equations:
As we saw in the "Off and On" video, the solution is immediately obvious at the intersection. In this case: `x = 6`, `y = -2`. But we’re just getting started.
Notice that if you graph a multiple of one of the equations, you get the same graph as the original. (For example, `4x+6y=12` will have the same graph as `2x+3y=6`.) This deserves a brief discussion.
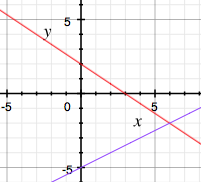
But here is where it gets interesting: if you graph a multiple of the first equation, plus a multiple of the second equation, the resulting line still passes through the original intersection. For example, by adding the two original equations, I get `3x + y = 16`. Here is the graph with the additional line:
Do this many times, to make sure everyone understands what’s going on. For example, subtract the equations, or add twice the first equation to three times the second, and so on. These are called linear combinations of the two equations. Of course, you may discuss why the new line always passes through the intersection.
Now start over with a new system, and challenge the students to come up with a linear combination that will create a vertical line through their intersection, and one that will create a horizontal line through it. (One teacher I knew years ago called this activity “add till it’s plaid”.)
Graph all suggestions, until someone figures it out. Give hints if necessary. Once someone has succeeded, discuss how that feat was accomplished.
Finally do this with yet another system, but no graphing. Tada! The method that was used to get the horizontal and vertical line is one way to solve the system.
In this video, I do an abbreviated version of this lesson:
This lesson is a version of (a part of) 10.6 in Algebra: Themes, Tools, Concepts.
Yet another version, by Chris Bolognese, is available on Desmos.