If a concept is important, we should teach it more than once, and preferably in more than one way. Rate of change is important! Is there anything to add to the oft-repeated "rise over run" mantra? Yes! Whether you're teaching middle school, or calculus, or anything in between, you should be able to find some useful ideas on this page. For more detail, click the links!
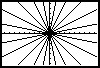
- A puzzle based on an unsolved problem: No Three on a Line. How many points can you put on an `n` by `n` lattice so that no three points are on a line? There is a conjecture that you can place `2n` points under this constraint, but as `n` gets bigger, it’s not so easy to do. Here is a successful example where `n = 4`:

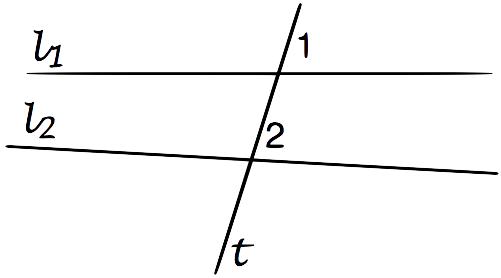
Having students check each other’s attempts forces a discussion of slope — possibly long before the concept has been discussed or even named. This activity can be done in late elementary school, or frankly at any time: the challenge is equally engaging for students at any level and even to their teachers. - Similar Rectangles, a geoboard lesson in Geometry Labs 10.2. A visual way to assess whether their sides are proportional is to superpose the rectangles, so that they share a vertex, and the short and long sides extend in the same direction. In this setup, if they share a diagonal, then the rectangles are indeed similar.
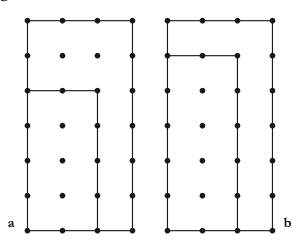
This test rests on understanding slope: if the rectangles share a diagonal, it means that the “rise over run” for each are equivalent fractions. - "Real world" examples. Algebra: Themes, Tools, Concepts (ATTC) is the textbook I co-authored with Anita Wah in the 1990’s. The importance we gave to slope is reflected in the fact that we included that topic, more or less explicitly, in at least two dozen lessons: 2.9, 3.8, 4.4, 4.5, 4.8, 4.11, 5.C, 6.8, 8.1-8.A, 8.8, 8.9, 9.2, 9.A, 9.C, 10.3, 10.6, 10.8, l2.A, 12.5, 12.8.
Many of those involve input-output tables, Cartesian graphs, and “real world” scenarios, for example:- A preview involving Celsius-Fahrenheit conversion: A Hot Day
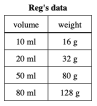
- Density of a mystery substance: In the Lab
- Circumference vs. diameter in Jarring Discoveries (scroll down)
- A growing child’s height and weight.
- Stair safety: Stairs and Squares
- Modeling Motion
- Some ATTC lessons involve function diagrams, a parallel axes representation of functions. Here is a diagram for `y=2x-3`:
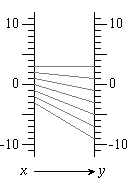
In this representation, you can think of rate of change as magnification. In the above example, when `x` increases by (say) 3 units, `y` increases by 6 units: the magnification is 2. I try to use the word slope when discussing a Cartesian graph, rate of change when discussing a table of values, and magnification when discussing a function diagram. I have a fond memory of a student exclaiming: “Those are all the same thing!”, something I do not initially stress, or even mention.
Go to the Function Diagrams home page for a lot more information, including a lesson about operations for middle school, all the way to a visual explanation of the chain rule in calculus. See also Kinesthetic Function Diagrams. - The visual representation of “rise over run” is a slope triangle. Adjacent slope triangles make a sort of visual staircase. I created a puzzle-like GeoGebra-based applet called Stairs. This image should give you a sense of how it works.
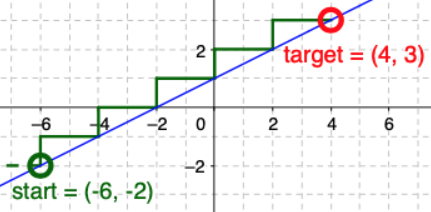
Lines can be graphed in there as well, which allows for additional possibilities, such as point-point or point-slope graphing challenges. I share a worksheet, but the applet can be used with your own worksheets, and/or student-created puzzles. - Make These Designs using `y = mx + b` in an electronic grapher. This is one of the most popular lessons I've ever created, and was declared a "hall of famer" by Dan Meyer. Students must choose the `m`'s and `b`'s that will achieve the desired result. Here is a typical target design from the graphing-calculator era:
The activity can be done in any electronic grapher. - Doctor Dimension is a different visualization of rate of change in a set of related applets, culminating in a challenging set of exercises.
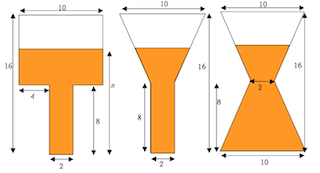
It is a geometric context to discuss rate of change in piecewise functions. The activities range from eighth to twelfth grade. The basic idea is to see how the rate of change changes as the “liquid” fills the “containers” as displayed above. This includes linear and nonlinear cases, and the inspection of the corresponding graphs. In precalculus, it allows for a discussion of “concave up” vs. “concave down”. In calculus, continuity and differentiability get into the picture. - Slope Angles is an introduction to trigonometry in Geometry Labs. (Do Lab 11.2 before 11.1). “Rise over run” is a particular case of “opposite over adjacent”. So the standard trig exercise suggested by this image can be solved without mentioning trig at all:
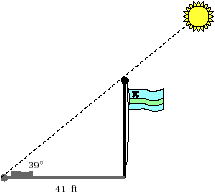
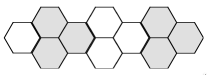
This involves the use of the ten-centimeter circle. After several problems of this type, once the basic idea is understood, the tangent ratio can be introduced, along with the corresponding calculator key or other electronic method to find the tangent or arctan. Sine and cosine can be brought into the picture later. - Pattern Block Trains originated as a fifth grade introduction to rate of change, but I saved it for last here because I extended it to end with an extremely challenging question, pretty much aimed at teachers.
- Finally, for teachers and math nerds: a formal proof of `y = mx + b` using basic geometry. A curious fact about high school math is that students (and teachers!) never see a proof that the graph of `y = mx + b` is indeed a straight line, and conversely that a non-vertical line satisfies an equation of the form `y = mx + b`. I offer a worksheet that guides teachers (and students?) through such a proof. The prerequisites are basic geometry theorems and some mathematical maturity.
Teaching the same thing the same way will yield the same result. A quick scan of the above shows images that look completely different from each other. Students appreciate variety: Math class should not always be the same day after day! One way to mix it up is to use different learning tools: dot paper, geoboard, input-output tables, electronic graphers, online applets, function diagrams, the ten-centimeter circle, pattern blocks…
Using multiple representations, tools, and contexts has substantial benefits:
- For some students, it offers repeated entryways into the concept. This is crucial if the initial lessons do not break through or sink in.
- For students who grasp the concept early, it avoids boredom and presents varied applications of the concept. This is far preferable to “review” that consists of a rehash of the same lesson.
- It keeps the concept alive over an extended period of time (in this case, all secondary school grade levels.)
Well, I rest my case. I hope that I made my point, or at least that you found some activities to diversify and enrich your teaching!

Read an expanded version of this page on my blog, including links to big-picture articles about the importance of multiple representations and the foolishness of seeking "the best" way to teach an important concept.